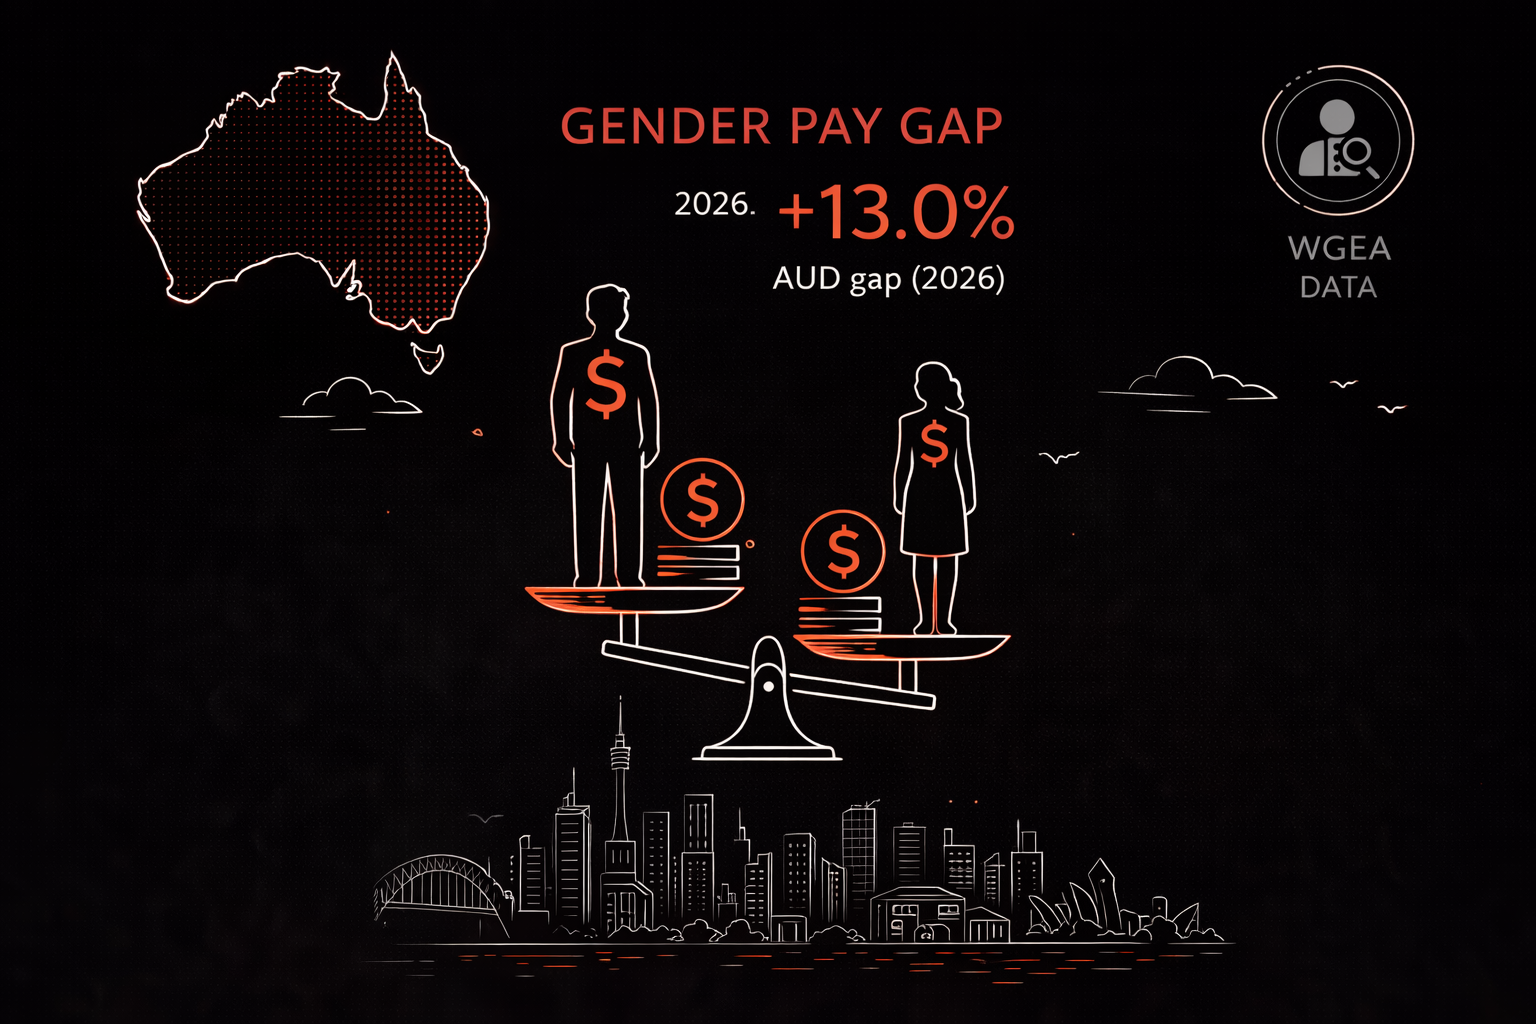
Australia’s gender pay gap in 2026 remains a measurable, data-confirmed reality — not an abstract talking point — with the Workplace Gender Equality Agency (WGEA) reporting a national base salary gap of approximately 21.8% between male and female full-time employees. That figure means, on average, women earn around 78 cents for every dollar earned by men. The gap has narrowed over the past decade, but the pace is slow and the structural drivers remain largely intact.
What the Gender Pay Gap Actually Measures
Before examining the numbers, it is worth being precise about what “gender pay gap” means — because the term is often used loosely and that creates confusion.
There are two distinct measures:
The unadjusted (raw) pay gap compares average earnings across all male and all female employees, regardless of occupation, industry, hours worked, or seniority. This is the headline figure WGEA reports. It captures the cumulative effect of occupational segregation, part-time work patterns, career interruptions, and discrimination all at once.
The adjusted pay gap controls for occupation, industry, and hours worked — measuring the gap between men and women doing equivalent roles. This figure is smaller, but it does not disappear. Research consistently finds a residual gap of 5–8% that cannot be explained by observable differences in role or experience — which points to direct pay discrimination or unmeasured factors.
WGEA’s data primarily reports the unadjusted gap. The ABS Average Weekly Earnings data, published biannually, provides a complementary measure tracking trends in male and female full-time adult ordinary time earnings over time.
The National Numbers
According to WGEA’s gender pay gap data, the national figures as of the most recent reporting period are:
| Measure | Pay Gap |
|---|---|
| Base salary (full-time) | ~21.8% |
| Total remuneration (incl. super, bonuses) | ~28.1% |
| Full-time weekly ordinary earnings (ABS) | ~13.3% |
The difference between the base salary gap and the total remuneration gap is significant. The additional ~6 percentage points come primarily from:
- Bonuses and incentive payments, which are more common and larger in male-dominated industries such as financial services, mining, and construction
- Superannuation contributions, which compound the gap over a working lifetime — women retire with materially less super than men on average
- Company car and other non-cash benefits, which skew toward senior roles disproportionately held by men
The ABS figure of 13.3% — drawn from its Average Weekly Earnings survey — appears smaller because it measures full-time ordinary hours only, excluding part-time workers (who are disproportionately female) and excluding bonuses and super.
Gender Pay Gap by Industry
The gap is not uniform. It varies dramatically by industry, and in a small number of sectors, it reverses — meaning women out-earn men on average.
| Industry | Gender Pay Gap (Base Salary) | Direction |
|---|---|---|
| Financial & Insurance Services | ~30.4% | Men earn more |
| Mining | ~26.1% | Men earn more |
| Construction | ~24.8% | Men earn more |
| Professional, Scientific & Technical | ~22.5% | Men earn more |
| Retail Trade | ~9.3% | Men earn more |
| Education & Training | ~6.1% | Men earn more |
| Health Care & Social Assistance | ~3.9% | Men earn more |
| Public Administration & Safety | ~5.2% | Men earn more |
| Arts & Recreation Services | ~-2.1% | Women earn slightly more |
Source: WGEA Employer Gender Pay Gap data, most recent available reporting period. Figures are approximate and based on WGEA’s published industry-level analysis.
The industries with the largest gaps — financial services, mining, construction — share a common feature: they have high concentrations of male employees in senior, high-bonus roles, and a pipeline problem that means women are underrepresented at leadership levels where remuneration accelerates.
Health care and education, by contrast, have much smaller gaps partly because they are female-dominated industries where women occupy a broader range of seniority levels — but also because pay structures in those sectors are more award-driven and less discretionary. For a broader picture of which industries are paying more overall in 2026, see our industry wages breakdown.
WGEA’s Employer-Level Data: What It Revealed
In February 2024, WGEA published employer-level gender pay gap data for the first time — naming individual companies with 100 or more employees and their reported pay gaps. This was a significant shift from aggregate reporting and created direct accountability pressure on large employers.
Key findings from that first publication:
- More than 50% of employers had a gender pay gap greater than 9.1% in favour of men
- Fewer than 30% of employers had a gap within the “target zone” of between -5% and +5%
- A small number of large employers had gaps exceeding 40%
- Some employers had negative gaps — meaning women earned more on average — typically in female-dominated workplaces such as childcare and aged care
The naming of individual employers produced immediate responses from some organisations — public commitments to close gaps, pay equity audits, and revised remuneration policies. Whether those commitments translate into measurable change in subsequent reporting rounds is a question the 2025 and 2026 WGEA data will answer.
Why the Gap Persists
Occupational Segregation
Australia’s workforce remains significantly segregated by gender. Women are overrepresented in caring and service occupations — nursing, teaching, childcare, aged care — which are systematically lower-paid than male-dominated occupations requiring comparable levels of skill and qualification. This is not simply a function of individual preference. Decades of research show that as female participation in an occupation rises, average pay in that occupation tends to fall relative to male-dominated fields.
Part-Time Work and Career Interruptions
Women are significantly more likely than men to work part-time, and to take extended career breaks for caring responsibilities. ABS data shows that women account for approximately 68% of all part-time workers in Australia. Part-time work typically carries lower hourly rates, fewer advancement opportunities, and reduced access to bonuses and non-wage benefits.
The superannuation impact of career interruptions is particularly acute. A woman who takes two years out of the workforce for parental leave and then works part-time for five years does not just lose five-plus years of earnings — she loses five-plus years of compounding super contributions at a time when that capital would otherwise be growing.
Leadership Representation
The proportion of women in senior leadership roles — where remuneration is highest — has increased but remains below 50% in most industries. WGEA data shows women hold approximately 40% of manager-level roles nationally, but that share drops at each successive level of seniority. At CEO and board level, female representation is higher than it was a decade ago but still does not reflect the gender composition of the broader workforce.
This matters because pay gap data is a function of who is in which roles. If women are underrepresented at the top of pay distributions, the average gap will persist regardless of whether individual pay decisions are equitable.
What the Law Requires
The Fair Work Act includes equal remuneration provisions that allow employees to apply for equal remuneration orders where work of equal or comparable value is paid differently on the basis of gender. The Fair Work Commission can make orders requiring employers to increase pay where gender-based undervaluation is established.
In practice, equal remuneration cases are complex and resource-intensive to pursue. The most significant recent case involved the social and community services sector, where a successful equal remuneration application resulted in substantial pay increases for a predominantly female workforce — but that case took years to resolve and required union coordination that most individual workers cannot replicate.
The WGEA Act requires employers with 100 or more employees to submit an annual report to WGEA covering workforce composition, pay data, and policies. From 2024, that data is published publicly at the employer level. Non-compliance can result in an employer being named as non-compliant and losing access to certain government contracts.
The Superannuation Gap
The gender pay gap does not end at retirement — it compounds into it.
AIHW data indicates that women retire with superannuation balances approximately 25–30% lower than men on average. The causes are direct extensions of the pay gap:
- Lower earnings throughout working life mean lower super contributions
- Career breaks and part-time work reduce years of contributions
- Lower lifetime earnings mean less capacity for voluntary contributions
From July 2025, super is payable on Commonwealth Paid Parental Leave — a policy change designed specifically to reduce the super gap for women who take parental leave. The impact will take years to show in aggregate balance data, but it represents a structural change to how the system treats career interruptions.
Has the Gap Been Narrowing?
Yes, but slowly. WGEA’s historical data shows the national base salary gap has moved from approximately 24% a decade ago to approximately 21.8% today — a reduction of roughly 2 percentage points per decade at the current pace.
At that rate, closing the gap entirely would take several more decades. Most analysis suggests that closing it fully would require simultaneous progress on occupational segregation, leadership representation, parental leave policy, and direct pay equity — not just one of those levers in isolation.
FAQ
What is Australia’s gender pay gap in 2026?
WGEA data shows Australia’s national gender pay gap on base salary is approximately 21.8%, meaning women earn around 78 cents for every dollar earned by men on average. The total remuneration gap, including superannuation and bonuses, is approximately 28%.
Is the gender pay gap the same as unequal pay for the same job?
No. The gender pay gap is an average measure across all workers — it captures occupational segregation, part-time patterns, and seniority gaps, not just pay discrimination between individuals in identical roles. The adjusted gap — controlling for occupation and hours — is smaller but does not disappear entirely.
Which industries have the biggest gender pay gaps in Australia?
Financial and insurance services, mining, and construction have the largest gaps. Health care, education, and public administration have smaller gaps, partly due to award-based pay structures that are less discretionary.
Does the gender pay gap affect superannuation?
Significantly. Women retire with superannuation balances approximately 25–30% lower than men on average, per AIHW data. The gap is a direct product of lower earnings, career interruptions, and greater part-time work over a working lifetime.
What is WGEA and what data does it publish?
The Workplace Gender Equality Agency is a Commonwealth statutory agency established under the Workplace Gender Equality Act 2012. It collects annual workforce data from employers with 100 or more employees and publishes gender pay gap data — including, since 2024, employer-level data naming individual organisations. Full data is available at wgea.gov.au.
Conclusion
Australia’s gender pay gap in 2026 is measurable, persistent, and driven by structural forces that go well beyond individual pay decisions. The WGEA data shows the gap narrowing over time, but at a pace that reflects incremental progress rather than systemic change. The publication of employer-level data from 2024 onwards has introduced a new layer of accountability — but accountability alone does not close a gap rooted in occupational segregation, career interruption patterns, and underrepresentation in high-paying senior roles. The numbers will improve when those underlying conditions change.
This article is for informational purposes only and does not constitute financial, legal, or employment advice. Data is sourced from publicly available Australian government sources and is accurate at time of publication. Please consult a registered professional for advice specific to your situation.