Average Salary in Australia 2026 — By Industry, State and Full-Time vs Part-Time
Average salaries in Australia have been rising — but not uniformly, and not always fast enough to keep pace with the cost of living. The latest data from the Australian Bureau of Statistics tells a more nuanced story than the headline figure suggests.
Here is a complete breakdown of average earnings in Australia in 2026, based on the ABS Average Weekly Earnings survey for November 2025, published on 26 February 2026.
What Is the Average Salary in Australia in 2026?
Average weekly ordinary time earnings for full-time adults were $2,051.10 in November 2025, according to the ABS. This represents a rise of 3.8 per cent over the year — an extra $75.30 per week compared to November 2024.
Expressed as an annual salary, this translates to approximately $106,657 per year for full-time adults on ordinary time earnings.
However, that figure is the average — not the median. The median tells a different story. Median weekly earnings for all employees — including part-time and casual workers — were $1,436 per week, or approximately $74,672 per year. The gap between the average and the median reflects the pull of high earners in mining, finance, and technology on the overall figure.
The two numbers to hold in your head:
- Average full-time salary: ~$106,657/year (AWOTE, November 2025)
- Median salary all workers: ~$74,672/year (including part-time and casual)
For more on how your salary is taxed in Australia, see our Australia tax rates 2026 guide.
Average Salary by Industry in Australia 2026
Industry is the single biggest determinant of earnings in Australia. Mining remains the highest-paying industry by a significant margin, with average weekly earnings of $3,174.40 for full-time employees — more than double the retail and hospitality sectors.
| Industry | Average Weekly Earnings (Full-Time) | Estimated Annual |
|---|---|---|
| Mining | $3,174.40 | ~$165,069 |
| Information Media & Telecommunications | $2,685.10 | ~$139,625 |
| Financial & Insurance Services | $2,338.60 | ~$121,607 |
| Professional, Scientific & Technical | $2,375.90 | ~$123,547 |
| Electricity, Gas, Water & Waste | $2,514.20 | ~$130,738 |
| Public Administration & Safety | $2,147.90 | ~$111,691 |
| Education & Training | $2,153.40 | ~$111,977 |
| Health Care & Social Assistance | $1,996.30 | ~$103,808 |
| Construction | $1,958.20 | ~$101,826 |
| Transport, Postal & Warehousing | $1,948.40 | ~$101,317 |
| Manufacturing | $1,833.40 | ~$95,337 |
| Arts & Recreation Services | $1,826.90 | ~$94,999 |
| Wholesale Trade | $1,921.50 | ~$99,918 |
| Retail Trade | $1,565.20 | ~$81,390 |
| Accommodation & Food Services | $1,501.60 | ~$78,083 |
Source: ABS Average Weekly Earnings, Australia, November 2025. Original estimates, full-time adults.
The spread between the top and bottom is stark. A full-time worker in mining earns more than twice what a full-time worker in accommodation and food services earns. For workers in retail — Australia’s second-largest employing industry — average weekly earnings of $1,565.20 translate to roughly $81,390 annually, well below the national full-time average.
Average Salary by State in Australia 2026
Geography also matters significantly. The ACT recorded the highest average weekly earnings at $2,249.00, followed by Western Australia at $2,189.20 and New South Wales at $2,086.80.
| State/Territory | Average Weekly Earnings (AWOTE) | Estimated Annual |
|---|---|---|
| ACT | $2,249.00 | ~$116,948 |
| Western Australia | $2,189.20 | ~$113,838 |
| New South Wales | $2,086.80 | ~$108,514 |
| Victoria | $2,011.20 | ~$104,582 |
| Queensland | $1,987.30 | ~$103,340 |
| Northern Territory | $1,944.40 | ~$101,109 |
| South Australia | $1,934.40 | ~$100,589 |
| Tasmania | $1,820.90 | ~$94,687 |
Source: ABS Average Weekly Earnings, Australia, November 2025 (AWOTE trend estimates).
The ACT’s high average reflects its concentration of public sector workers — federal government employment is heavily weighted toward Canberra. Western Australia’s elevated earnings are driven by the mining sector, which employs a significant share of the state’s workforce. Tasmania sits at the bottom of the state rankings, reflecting a lower concentration of high-paying industries and a higher share of part-time and casual employment.
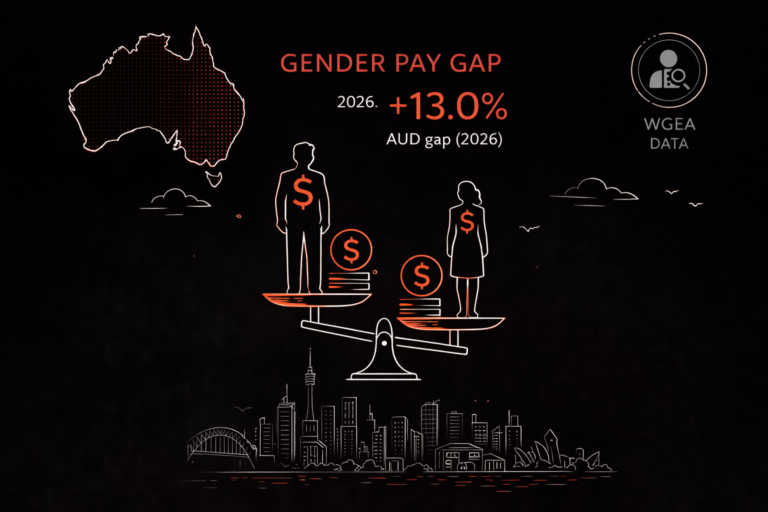
Average Salary by Gender
The gender pay gap in average weekly ordinary full-time earnings remained at 11.5 per cent in November 2025 — the equal lowest recorded in this series.
In dollar terms:
| Sector | Male Average Weekly Earnings | Female Average Weekly Earnings |
|---|---|---|
| Public sector | $2,347.50 | $2,101.60 |
| Private sector | $2,109.10 | $1,813.30 |
The gap is wider in the private sector than the public sector. Public sector pay structures — driven by enterprise agreements and standardised pay scales — narrow the gap more effectively than private sector markets, where negotiated salaries and bonus structures tend to favour men disproportionately.
For a deeper analysis of what drives this gap, see our article on the gender pay gap in Australia 2026.
Average vs Median — Why the Difference Matters
The average salary figure gets reported widely but it misleads most workers trying to benchmark their pay.
Averages are pulled upward by high earners. A single executive earning $500,000 per year has the same effect on an average as dozens of workers earning $60,000. The median — the middle point where half earn more and half earn less — is a more accurate benchmark for most people.
The median weekly earnings for all employees in Australia are $1,436 per week, with males at $1,674 and females at $1,250 per week.
If you are benchmarking your salary, compare against the median for your industry and state — not the national average. A retail worker in Tasmania benchmarking against $106,657 is comparing against a number that has almost no relevance to their actual labour market.
Has Wage Growth Kept Pace With Inflation?
Annual wage growth to November 2025 was 3.8 per cent — lower than the 4.5 per cent seen to May 2025 and the 4.6 per cent recorded to November 2024. Wage growth is slowing.
Over the same period, CPI inflation was running at approximately 2.4 per cent annually to March 2026. On that measure, real wages — purchasing power after inflation — are growing, but modestly and unevenly. Workers in lower-paying industries where wage growth is below the national average are not keeping pace with rising costs for housing, energy, and groceries.
I work in retail management in Sydney and the gap between what the wage data shows and what workers experience in their weekly budget is real. The national average figure does not reflect what most retail and hospitality workers take home — industries that employ the largest share of Australia’s workforce.
When Is the Next ABS Wage Data Release?
The ABS publishes Average Weekly Earnings data twice a year — for the May and November reference periods. The next release covering May 2026 is scheduled for 13 August 2026. That release will show whether wage growth has continued slowing into 2026 or whether the tight labour market has sustained earnings growth.
Frequently Asked Questions
What is the average salary in Australia in 2026?
The average full-time salary in Australia is approximately $106,657 per year, based on average weekly ordinary time earnings of $2,051.10 in November 2025 — the most recent ABS data. However, the median salary for all workers including part-time and casual employees is closer to $74,672 per year. Most workers earn below the headline average figure.
Which industry pays the most in Australia?
Mining is the highest-paying industry in Australia by a significant margin, with average full-time weekly earnings of $3,174.40 — approximately $165,000 annually. Information media and telecommunications is second at $2,685.10 per week, followed by professional, scientific and technical services at $2,375.90.
Which state has the highest average salary in Australia?
The ACT has the highest average weekly earnings at $2,249.00, largely due to its concentration of federal public sector workers. Western Australia is second at $2,189.20, driven by the mining industry. Tasmania has the lowest average at $1,820.90.
What is the average hourly wage in Australia in 2026?
According to ABS Characteristics of Employment data, median hourly earnings in Australia are $42.90 per hour. Managers earn the most at an average of $69.20 per hour, followed by professionals at $64.50 per hour.
Is the average salary in Australia enough to live on?
Whether the average salary is sufficient depends heavily on location and household structure. In Sydney, where median rents for a two-bedroom unit exceed $650 per week, a single person on the median salary of $1,436 per week spends close to 45 per cent of gross income on rent alone — well above the 30 per cent affordability threshold. For more on housing costs relative to incomes, see our article on rent prices in Australia 2026.
How does Australian average salary compare to the minimum wage?
The national minimum wage for 2025–26 is $24.10 per hour or $915.90 per week — well below the median weekly earnings of $1,436. Most employed Australians earn above the minimum wage through award rates, enterprise agreements, or individual arrangements. For the most current minimum wage rates, see our Australia minimum wage 2026 guide.
Key Takeaways — Average Salary Australia 2026
The average full-time salary in Australia is approximately $106,657 per year based on ABS November 2025 data, but the median for all workers is closer to $74,672. Mining pays more than double accommodation and food services. The ACT and Western Australia record the highest state averages. Annual wage growth has slowed to 3.8 per cent. The gender pay gap sits at 11.5 per cent — the equal lowest on record. The next ABS data release covering May 2026 is due on 13 August 2026.
General information only. Salary data sourced from ABS Average Weekly Earnings, Australia, November 2025 (released 26 February 2026). Figures are pre-tax averages and do not account for superannuation, salary sacrifice, or individual employment conditions. Verify current data at abs.gov.au.