Australia Housing Affordability 2026 — House Price to Income Ratio, Deposit Timelines and What the Data Shows
Australia’s housing affordability has reached the worst levels on record. The national median dwelling value sits at $922,838 as at February 2026 according to Cotality, while the average Australian household needs 11 years to save a deposit. Only 14% of median income households can afford to buy the median-priced home nationally — down from 43% just three years ago. This is not a housing market under pressure. It is a housing market that has structurally moved beyond the reach of ordinary Australians.
Here is what the data actually shows in 2026.
The Price-to-Income Ratio — National and by City
The most widely used measure of housing affordability is the median multiple — the median house price divided by the median pre-tax household income. A ratio of 3.0 or below is considered affordable. Above 5.1 is classified as severely unaffordable. Above 9.0 is considered impossibly unaffordable.
Australia’s national median multiple was 8.2 as at September 2025 according to Demographia’s International Housing Affordability report — placing Australia in the severely unaffordable category and among the worst-performing developed nations.
Price-to-income ratio by capital city (2026):
| City | Price-to-income ratio | Classification |
|---|---|---|
| Sydney | 10.1x | Impossibly unaffordable |
| Adelaide | 9.5x | Impossibly unaffordable |
| Brisbane | 9.1x | Impossibly unaffordable |
| National average | 8.2x | Severely unaffordable |
| Melbourne | 7.1x | Severely unaffordable |
Source: Cotality / Demographia International Housing Affordability, 2025-26
Sydney’s ratio of 10.1x means the median Sydney dwelling costs more than ten times the median annual household income. A decade ago that ratio was approximately 6x. The shift has been structural — driven by supply constraints, population growth, and sustained low interest rates in the 2010s — and has not reversed.
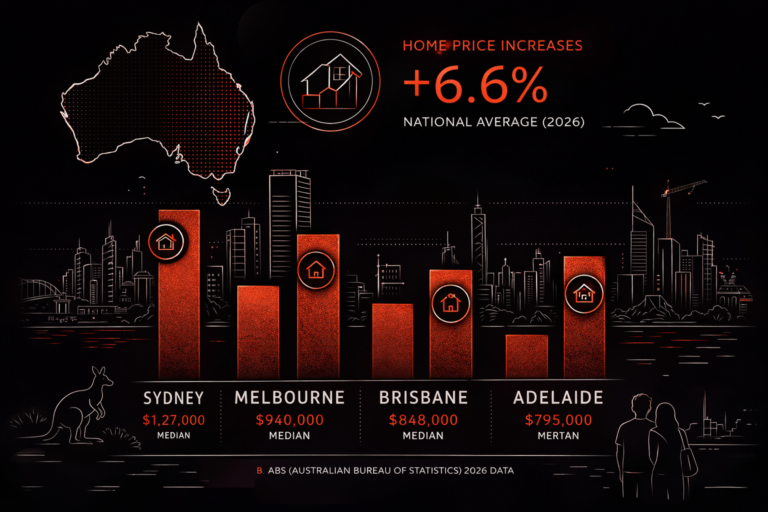
What It Actually Costs to Buy — Median Dwelling Values 2026
| Market | Median dwelling value |
|---|---|
| Combined capitals | $1,014,401 |
| National | $922,838 |
| Combined regional | $751,327 |
Source: Cotality Home Value Index, February 2026
National dwelling values rose 9.9% year-on-year by February 2026 — adding approximately $83,000 to the median value in 12 months. The pace of growth has been uneven across cities, with Perth growing 90.3% over the five years to February 2026 (+$469,000), Brisbane up 86.1% (+$500,000), and Melbourne recording the softest growth at just 11.8% (+$87,000) over the same period.
For the full breakdown of what properties actually cost in each city and how prices have moved in 2026, see our house prices Australia 2026 guide.
Mortgage Serviceability — The Real Affordability Crunch
The price-to-income ratio tells you how expensive housing is relative to income. But mortgage serviceability tells you the more immediate story — what percentage of your household income goes to servicing a new mortgage at today’s interest rates and today’s prices.
Nationally, that figure sits at 45.9% of gross household income — nearly 12 percentage points above the long-run average of 34.3%. The standard benchmark for housing stress is 30%. Australia is already 15 percentage points above that threshold nationally.
Mortgage serviceability by city:
| City | % of income to service new mortgage |
|---|---|
| Sydney | 54.7% |
| Adelaide | 51.7% |
| Brisbane | 49.8% |
| National | 45.9% |
| Long-run national average | 34.3% |
| Melbourne | 38.6% |
| ACT | 33.4% |
Source: Cotality. Assumes 80% LVR on median dwelling value, average discounted variable rate, 30-year term
Sydney buyers are committing more than half their gross household income to mortgage repayments before any other expense. Cotality estimates that servicing a new housing loan in Sydney now requires approximately 68% of pre-tax household income — a figure that makes Sydney one of the least affordable cities in the world. Only Hong Kong ranks worse globally on the median multiple measure.
The RBA’s back-to-back cash rate hikes in February and March 2026 — taking the cash rate to 4.10% — have tightened serviceability further. With financial markets pricing in up to three more hikes in 2026, buyers face an environment where every percentage point increase in the cash rate adds hundreds of dollars per month to new mortgage repayments. For the full picture of how rate rises affect mortgage costs, see our RBA cash rate mortgage repayments guide.
How Long Does It Take to Save a Deposit?
At current savings rates — after rent and living expenses — the average Australian takes 11 years to save a 20% deposit on the median dwelling nationally. In Sydney, with a median house value approaching $1.75 million, that timeline stretches considerably further.
The 20% deposit on the national median of $922,838 is approximately $184,568. On a median full-time annual wage of approximately $100,000, saving that amount requires near-total sacrifice of discretionary spending — and assumes prices do not continue rising in the meantime. In practice, for every year of saving, the price rise often adds more to the required deposit than the savings accumulated.
The federal government’s 5% deposit scheme — expanded in October 2025 to be demand-driven with no cap — allows eligible first home buyers to enter with a 5% deposit backed by a government guarantee. While it reduces the deposit barrier in dollar terms, economists including those at the Grattan Institute and the IMF have flagged that the scheme adds purchasing power without increasing supply — effectively bidding prices higher and transferring the affordability problem forward.
Rental Affordability — The Other Half of the Crisis
For the approximately one third of Australians who rent, affordability is equally severe. Australian households are now dedicating a record 33.4% of their pre-tax income to rent according to Cotality’s analysis. National rents have surged 42.9% over five years — adding approximately $204 per week to the median rental value.
The rental stress threshold — spending more than 30% of income on rent — is already exceeded nationally on average. For low-income households the situation is more acute. A household at the 25th percentile of income (earning approximately $961 per week) spending the 25th percentile rent value ($521 per week) is allocating 54.3% of income to rent — a series record.
With the national rental vacancy rate at 1.0% as at March 2026 and five of eight capital cities in acute shortage territory, renters have virtually no bargaining power. For the full vacancy rate data by city, see our rental vacancy rates guide.
The Supply Problem — Why It Is Not Getting Better
The core driver of Australia’s affordability crisis is structural undersupply. The federal government’s Housing Accord set a target of 1.2 million new homes over five years. The National Housing Supply and Affordability Council (NHSAC) forecasts actual delivery of approximately 938,000 dwellings — a shortfall of 262,000 homes. The Council expects the housing shortage to worsen by a further 79,000 over the five years to 2028-29.
The weakest delivery is expected in New South Wales, Tasmania, and the Northern Territory. Higher-density apartment construction remains constrained by poor project feasibility — construction costs are high, pre-sales are difficult to achieve, and planning approvals remain slow.
Net overseas migration of 300,000+ in 2025-26 continues to add demand faster than supply can respond — particularly in rental markets, where new arrivals compete directly for available stock.
Buyer Confidence at Record Lows
The Westpac-Melbourne Institute “time to buy a dwelling” index fell to 82.9 in March 2026 — a new cycle low and well below its long-run average of 120. The deterioration was most pronounced among households with a mortgage, highlighting the growing tension between persistent housing demand and stretched affordability.
PropTrack’s Housing Affordability Report found that only 14% of median income households can afford to buy the median-priced home nationally in 2026 — down from 43% just three years ago. In Sydney that figure is just 10%.
Key Takeaways
Australia’s national price-to-income ratio is 8.2x — severely unaffordable by international standards. Sydney is at 10.1x — impossibly unaffordable. Mortgage serviceability nationally is 45.9% of gross household income, against a long-run average of 34.3%. It takes the average Australian 11 years to save a deposit. Only 14% of median income households can afford the median home. Renters spend a record 33.4% of income on rent. The housing shortage will worsen further — the Housing Accord target will be missed by 262,000 dwellings. Two RBA rate hikes in 2026 have added further pressure and more hikes are possible.
This is not a cyclical problem with a near-term fix. It is a structural mismatch between supply, demand, income, and prices that has been building for two decades.
Frequently Asked Questions
What is Australia’s house price to income ratio in 2026?
Australia’s national median multiple — median house price divided by median household income — is 8.2 as at 2025-26 according to Demographia. Sydney is the worst at 10.1x, followed by Adelaide at 9.5x and Brisbane at 9.1x. Melbourne is the most affordable major city at 7.1x.
What percentage of income do Australians spend on mortgages in 2026?
Nationally, servicing a new mortgage on the median dwelling requires 45.9% of gross household income — well above the 30% housing stress threshold and 12 percentage points above the long-run average of 34.3%. In Sydney it is 54.7% and on Cotality’s broader measure approximately 68% of pre-tax income.
How long does it take to save a house deposit in Australia in 2026?
The average Australian takes approximately 11 years to save a 20% deposit on the median dwelling, after rent and living expenses. In Sydney, where median house values approach $1.75 million, the timeline is longer.
What percentage of Australians can afford to buy a home in 2026?
Only 14% of median income households can afford the median-priced home nationally, down from 43% three years ago, according to PropTrack’s Housing Affordability Report. In Sydney, only 10% of median income households can afford the median dwelling.
Why is Australian housing so unaffordable?
Three structural factors: chronic undersupply of new dwellings — Australia will miss its Housing Accord target by 262,000 homes — strong population growth through net overseas migration of 300,000+ per year, and two decades of price growth that has far outpaced wage growth. Rising interest rates in 2026 have added further pressure on buyers.
Is housing affordability getting better or worse in 2026?
Worse. Back-to-back RBA rate hikes in February and March 2026 tightened serviceability further. Financial markets are pricing in up to three more hikes in 2026. The housing shortage is projected to worsen. Rental vacancy rates are near record lows. There is no near-term catalyst for meaningful improvement in affordability.
What is housing stress in Australia?
Housing stress is the condition of spending more than 30% of gross income on housing costs — rent or mortgage. Australia’s national mortgage serviceability ratio is already 45.9% and the average renter spends 33.4% of pre-tax income on rent — both above the 30% threshold.
This article is for general informational purposes only and does not constitute financial or property investment advice. Data is sourced from Cotality, Demographia, PropTrack, NHSAC, and publicly available ABS data. Always verify current figures with primary sources and consult a registered financial adviser for advice specific to your circumstances.