Rental Vacancy Rates Australia 2026 — Sydney, Melbourne, Brisbane and Every Capital City
Australia’s rental vacancy rate fell to 1.0% in March 2026 according to SQM Research — down from 1.1% in February and approaching the acute shortage threshold. That means just 31,732 rental properties were sitting empty across the entire country. For tenants, it means competition for available properties is as intense as it has been in years. For renters trying to understand why finding a home is so difficult, the vacancy rate data tells the story directly.
Here is the latest rental vacancy rate data for every Australian capital city in 2026, sourced from SQM Research and Domain’s March 2026 Rent Report.
National Rental Vacancy Rate — March 2026
Australia’s national rental vacancy rate sits at 1.0% as at March 2026, according to SQM Research monthly data. Domain’s separate March 2026 Rent Report places the national figure even lower at approximately 0.7% — a record low.
The difference reflects methodology — SQM monitors online listings while Domain tracks a broader definition of available stock — but both measures point to the same conclusion: the Australian rental market remains severely undersupplied.
For context, a vacancy rate between 2.0% and 3.5% is considered balanced — meaning roughly equal supply and demand. Pre-2020, Australia’s national vacancy rate consistently sat in this range. Today it is less than half that.
SQM Research vacancy rate classification:
| Rate | Classification |
|---|---|
| Below 1.0% | Acute shortage |
| 1.0% to 1.2% | Tight |
| 1.3% to 1.9% | Below balance |
| 2.0% to 3.5% | Balanced |
| Above 3.5% | Tenant’s market |
Australia is currently in the tight band nationally, with five of eight capital cities sitting at or below 1.0% — in the acute shortage zone.
Rental Vacancy Rates by Capital City — 2026
| City | Vacancy rate | Classification |
|---|---|---|
| Darwin | 0.4% | Acute shortage |
| Hobart | 0.4% | Acute shortage |
| Perth | 0.5% | Acute shortage |
| Adelaide | Sub-1.0% | Acute shortage |
| Brisbane | 0.8% | Acute shortage |
| Sydney | 1.1% | Tight |
| Canberra | 1.1% | Tight |
| Melbourne | 1.4% | Below balance |
Source: SQM Research monthly vacancy bulletin, March–April 2026
Melbourne is the only capital city with a vacancy rate approaching the lower end of balance. Every other capital is in acute shortage or tight territory. Even Melbourne’s 1.4% is well below the pre-pandemic norm of 2.5–3.0% for that market.
Sydney — Vacancy Rate 1.1%
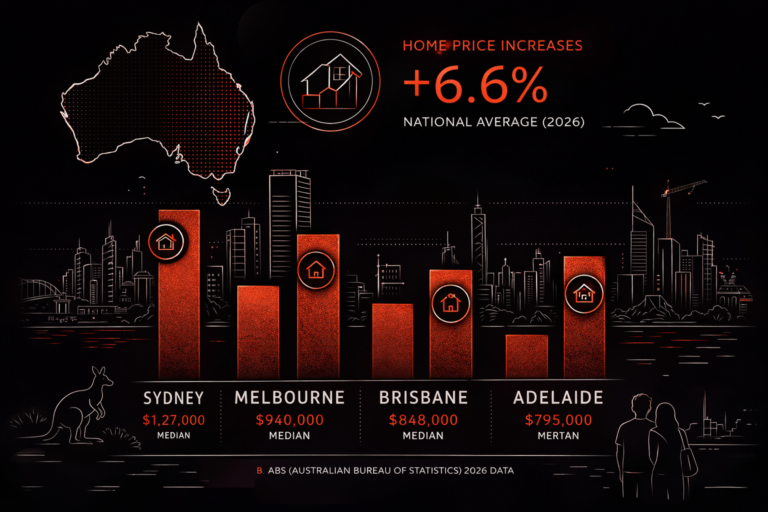
Sydney’s vacancy rate sits at 1.1% — classified as tight. Despite being one of the higher readings among capital cities, the reality for Sydney renters is brutal: median weekly rents for houses have reached approximately $900 per week and units around $792 per week based on Domain forecasts for 2026.
Sydney rents grew 7.4% annually according to SQM data, driven by ongoing demand from international migration and a construction pipeline that falls well short of need. Sydney needs approximately 27,000 new homes per year but is building only around 12,300 apartments annually — a structural shortfall that keeps vacancy compressed.
For full context on what Sydney renters are paying, see our average rent Australia 2026 guide.
Melbourne — Vacancy Rate 1.4%
Melbourne’s vacancy rate of 1.4% is the loosest of any capital city — but loosest is relative. At 1.4%, Melbourne is still well below the balanced threshold of 2.0%.
Domain’s March 2026 Rent Report notes that Melbourne is seeing units lead rent growth — unit rents have reached record highs as renters are priced out of houses and shift to medium-density stock. House rents in Melbourne have effectively hit an affordability ceiling, meaning further price growth is slowing not because supply has improved but because renters simply cannot pay more.
Melbourne’s housing supply shortfall is the largest of any capital city in absolute terms — the city needs approximately 39,500 new homes per year but is building only around 8,200 apartments annually according to CBRE analysis.
Brisbane — Vacancy Rate 0.8%
Brisbane’s vacancy rate of 0.8% places it firmly in acute shortage territory. Rents grew 6.8% annually and are sitting at record highs — houses in the high-$600s per week and units in the mid-$600s.
Domain notes Brisbane is a market still rising but with growth shifting increasingly toward units as renters seek relatively more affordable options. The lead-up to the 2032 Olympics continues to generate infrastructure investment and population growth that sustains demand pressure.
Perth — Vacancy Rate 0.5%
Perth is one of the tightest rental markets in the country at 0.5% vacancy. Rents grew 6.9% annually — the second-highest growth rate of any capital after Hobart.
Perth is notable for combining acute vacancy with meaningful rental yields for investors — gross rental yields in the 4.0–4.5% range on houses, compared to approximately 3.3% in Sydney — meaning supply is tighter and rental income is higher relative to property values. For renters, that translates to both high prices and minimal bargaining power.
Hobart and Darwin — The Tightest Markets
Hobart and Darwin both sit at 0.4% vacancy — the lowest in the country. Hobart led all capital cities in annual rent growth at 12.5% year-on-year. Darwin combines the tightest vacancy nationally with the highest rental yields, in the 6.0–7.5% gross range for houses.
Both cities have small total rental markets, meaning a relatively small number of vacancies translates to a very low percentage figure — but the competitive conditions for tenants are real regardless of market size.
What Is Driving the Shortage?
Three forces are running simultaneously and have been building since 2022:
Population growth outpacing construction — International migration resumed strongly after 2022 and has continued at elevated levels into 2026. New dwelling construction — particularly apartments — has not kept pace. CBRE’s March 2026 analysis forecasts apartment rents will rise 27% nationally by 2030 if current supply/demand dynamics continue.
Rising construction costs — Building costs have increased sharply since 2022, making new apartment developments less financially viable for developers. The gap between what it costs to build and what the market will pay has constrained new supply. For how this feeds into broader housing costs, see our house prices guide.
Higher interest rates reducing investor activity — The RBA’s cash rate increases in February and March 2026 to 4.10% have increased borrowing costs for property investors, reducing the incentive to add rental stock to the market. See our RBA interest rates guide for the full rate timeline.
What It Means for Renters in 2026
SQM Research director Louis Christopher has warned that without a significant increase in new housing supply or a stabilisation of population growth, rental pressures will remain elevated throughout 2026.
The build-to-rent (BTR) pipeline — approximately 6,000–6,500 new apartments nationally in 2026 — represents a growing segment but still a small fraction of the overall rental market. It will not resolve vacancy compression in the near term.
For tenants, the practical implication is continued competition at inspections, limited negotiating power on price or conditions, and upward pressure on rents in most markets. Domain’s affordability ceiling analysis suggests some markets — particularly Sydney and Melbourne houses — may see price growth moderate, not because conditions are improving but because renters have simply hit the limit of what they can pay.
National average rents across all capital cities now sit at $791.44 per week — up 5.9% over the past year. For a full breakdown of what renters are actually paying across the country, see our rent prices guide and our rental crisis explainer.
Frequently Asked Questions
What is Australia’s rental vacancy rate in 2026?
Australia’s national rental vacancy rate fell to 1.0% in March 2026 according to SQM Research — down from 1.1% in February. Domain’s March 2026 Rent Report places it even lower at approximately 0.7%. Both measures indicate severe undersupply across the national rental market.
What is Sydney’s rental vacancy rate in 2026?
Sydney’s vacancy rate is 1.1% — classified as tight. Despite being one of the higher readings among capital cities, Sydney renters face median weekly rents of approximately $900 for houses and $792 for units with very limited available stock.
What is Melbourne’s rental vacancy rate in 2026?
Melbourne’s vacancy rate is 1.4% — the highest of any capital city in 2026 and classified as below balance. While it is the loosest market nationally, it remains well below the 2.0% threshold considered balanced.
What is Brisbane’s rental vacancy rate in 2026?
Brisbane’s vacancy rate is 0.8% — in the acute shortage zone. House rents are in the high-$600s per week and units in the mid-$600s, both at or near record highs.
Which city has the lowest rental vacancy rate in Australia?
Darwin and Hobart are tied at 0.4% — the lowest vacancy rates of any capital city in 2026. Perth is close behind at 0.5%.
What is a healthy rental vacancy rate in Australia?
A vacancy rate between 2.0% and 3.5% is considered balanced — meaning roughly equal supply and demand. Below 1.0% is classified as acute shortage. Australia has not seen a balanced national vacancy rate since before 2022.
Will rental vacancy rates improve in 2026?
SQM Research director Louis Christopher has warned that without significant new housing supply or a stabilisation of population growth, vacancy rates will remain tight throughout 2026. The national build-to-rent pipeline of approximately 6,000–6,500 apartments is too small to move the needle materially.
Key Takeaways — Rental Vacancy Rates Australia 2026
Australia’s national vacancy rate is 1.0% as at March 2026 — near record lows. Five of eight capital cities are in acute shortage territory below 1.0%. Darwin and Hobart are the tightest at 0.4%. Melbourne at 1.4% is the loosest but still well below balance. Sydney rents are up 7.4% annually, Perth 6.9%, Brisbane 6.8%. The shortage is structural — driven by population growth outpacing construction — and will not resolve quickly. CBRE forecasts apartment rents rising 27% nationally by 2030 if supply constraints persist.
This article is for general informational purposes only. Vacancy rate data is sourced from SQM Research and Domain monthly reports. Figures are current as at March–April 2026 and subject to monthly revision. Always verify current data at sqmresearch.com.au.