Australia GDP 2026 ABS data confirms that the economy grew 2.6 percent in the year to December 2025, the strongest annual result since the December quarter of 2022. Released on 4 March 2026, the Australian Bureau of Statistics national accounts report showed quarterly growth of 0.8 percent in seasonally adjusted chain volume terms — beating market expectations of 0.6 percent and marking the seventeenth consecutive quarter of economic expansion. For an economy that spent most of 2023 and early 2024 grinding through near-zero per capita growth, the improvement is material. But as with most economic data, the headline number conceals a more complicated story underneath.
This article works through the ABS figures in detail, explains which parts of the economy drove growth, examines what the Reserve Bank of Australia made of it all, and puts the result into context for ordinary Australians who want to understand what economic growth actually means for their cost of living.
What does GDP actually measure?
Gross domestic product measures the total value of goods and services produced within Australia’s borders over a given period. It is not a perfect measure of living standards — it does not capture inequality, environmental costs, or unpaid work — but it remains the most widely used single indicator of economic performance. The ABS publishes GDP estimates quarterly using three approaches: expenditure, income, and production. All three should produce the same result in theory. In practice, a statistical discrepancy exists, which the ABS reconciles through its annual supply-use tables.
When economists and policymakers talk about “real” GDP growth, they mean growth adjusted for inflation using chain volume measures. Nominal GDP, which is not inflation-adjusted, rose 1.8 percent in the December quarter alone — faster than real growth — reflecting the continued presence of price pressures in the domestic economy.
The headline result: 0.8 percent quaterly, 2.6 percent annual
According to the Australian Bureau of Statistics, Australian GDP rose 0.8 percent in the December quarter 2025 in seasonally adjusted chain volume measures, and grew 2.6 percent compared to the same quarter a year earlier.
ABS head of national accounts Grace Kim noted that growth was broad-based, with rises observed across almost all industries. Both private and public demand each contributed 0.3 percentage points to overall GDP growth in the quarter. That balanced contribution is notable because much of Australia’s growth story in 2023 and 2024 leaned heavily on government spending to compensate for weak household demand. The December result suggests private sector activity is now carrying more of its own weight.
For the full 2024-25 financial year, the economy grew 1.4 percent in chain volume terms — modest by historical standards but a meaningful improvement on the subdued conditions that defined 2023-24.
What drove growth in the december quarter?
Breaking down the expenditure components gives a clearer picture of where growth came from and where it fell short.
Household consumption grew 0.3 percent in the quarter, contributing 0.1 percentage points to GDP. Discretionary spending led the increase, rising 0.4 percent. Categories within discretionary spending that performed strongly included hotels, cafes and restaurants, which rose 1.4 percent, coinciding with domestic travel during the school holiday and major events period. Recreation and culture rose 0.8 percent, supported by strong smartphone sales. An extended promotional period across Black Friday and Boxing Day drove strong results in furnishings and household equipment, which rose 2.1 percent, and clothing and footwear, which gained 1.3 percent.
Essential consumption grew more modestly at 0.2 percent. Health spending rose 1.3 percent, consistent with an extended flu season running into the December quarter. A notable offset came from electricity, gas and other fuels, which fell 9.5 percent — a reflection of increased electricity rebates being counted within government expenditure rather than household spending in the national accounts framework.
Private investment contributed 0.13 percentage points to GDP, with business spending on data centres and aircraft featuring prominently. Government expenditure contributed 0.21 percentage points and public investment added a further 0.05 percentage points, with transport infrastructure projects and higher defence outlays driving public capital spending.
Changes in inventories contributed 0.4 percentage points to growth — a somewhat mechanical contribution driven by firms rebuilding stock levels through both production and imports. Mining inventories saw a moderate rebuild, and retailers drew down stocks at a smaller pace than in the September quarter as extended promotional sales periods lifted demand.
Net trade was the one significant detractor, subtracting 0.1 percentage points from GDP. Imports of goods and services rose 1.8 percent, outpacing export growth of 1.4 percent. Export growth was driven by rural goods, particularly meat, where ongoing international demand for Australian beef and constrained lamb and mutton supply pushed prices and volumes higher. Higher export prices lifted the terms of trade by 0.4 percent for the quarter.
One of the most significant data points in the December quarter release was GDP per capita. After falling for seven consecutive quarters through 2023 and 2024 — an extraordinary per capita recession that coincided with strong headline growth largely driven by population increase — GDP per capita has now risen for four consecutive quarters. In the December quarter it rose 0.4 percent, and is 0.9 percent higher than a year ago. That is the highest through-the-year per capita growth recorded since the December quarter of 2022.
This matters because GDP per capita is a much better approximation of whether the average Australian is materially better off than aggregate GDP. Australia’s strong population growth from net overseas migration has consistently inflated total output numbers while masking the fact that output per person was deteriorating. The turnaround in per capita GDP is therefore a genuinely encouraging signal — though the RBA’s expectation that GDP growth will slow from late 2026 suggests the per capita recovery may be challenged again within the forecast horizon.
The household saving picture
The household saving to income ratio rose to 6.9 percent in the December quarter 2025, up from 6.1 percent in the September quarter. This is the highest level since the September quarter of 2022, when elevated savings were a residual of pandemic-period government transfers.
Rising savings rates represent a double-edged dynamic. On one hand, they indicate households are in a stronger financial position, with real disposable incomes recovering as inflation has eased from its peak and wage growth has run ahead of price rises through 2025. On the other hand, a household that saves rather than spends is contributing less to near-term consumption growth. The RBA noted in its February 2026 Statement on Monetary Policy that scheduled mortgage payments remain above their historical average and that above-average savings may partly reflect households taking advantage of higher interest rates to get ahead on debt — behaviour consistent with the ongoing impact of monetary policy tightening even after earlier rate reductions.
Australians looking to understand how the broader price environment affects household budgets may find it useful to read about what grocery data shows about the true cost of living for Australian households, which examines CPI and supermarket pricing patterns alongside income trends.
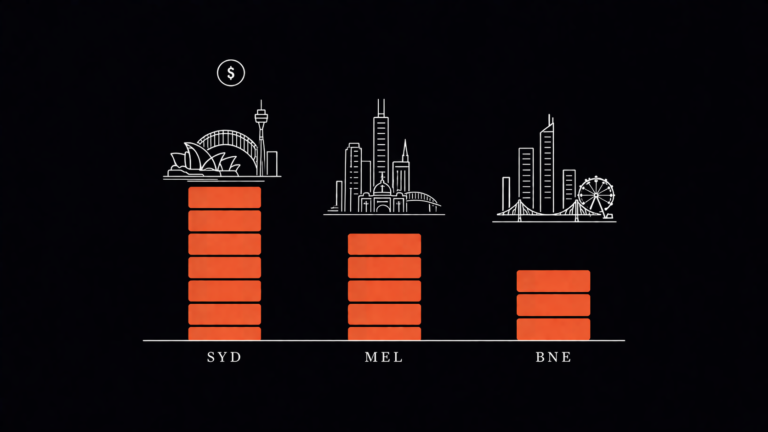
State-Level GDP performance
The ABS also publishes gross state product data, giving a breakdown of economic performance by state and territory. For the 2024-25 financial year, the Australian Capital Territory recorded the strongest result, growing 3.5 percent. Queensland was the strongest of the larger states at 2.2 percent, followed by Western Australia at 1.3 percent and Victoria at 1.1 percent.
The Queensland result reflects continued strength in resources, tourism, and infrastructure investment, including major projects tied to the 2032 Brisbane Olympics programme. Western Australia’s performance has been anchored by its mining sector, though the moderation from its earlier boom rates reflects softer commodity prices and some slowing in capital investment. Victoria’s 1.1 percent growth is comparatively weak for a state with Australia’s largest population, and reflects ongoing pressures in construction, elevated state government debt, and subdued consumer confidence through parts of the year.
The RBA’s respose: Rates back on the way up
The strong economic data through the second half of 2025 did not go unnoticed by the Reserve Bank of Australia. At its February 2026 Monetary Policy Board meeting, the RBA raised the cash rate target by 25 basis points to 3.85 percent, reversing part of the easing cycle that began in early 2025.
According to the RBA’s February 2026 Statement on Monetary Policy, underlying inflation rose to 3.4 percent over the year to the December quarter — materially higher than expected in the August 2025 forecast. Headline inflation reached 3.6 percent over the same period. The RBA described the pick-up as broad-based, spanning services, retail goods, and the cost of building new homes.
The central bank’s assessment is that the economy is further from balance than it had judged at the start of 2025. Private demand has been stronger than expected, driven by a recovery in household incomes, a rise in housing prices and dwelling investment, favourable financial conditions, stronger global growth, and a surge in business investment related to data centres and the green energy transition. Year-ended GDP growth is expected to remain above the RBA’s estimate of potential growth through most of 2026, before monetary policy tightening begins to slow activity from late in the year.
The RBA’s own forecasters project GDP growth will slow to around 1.6 percent by mid-2027, with the unemployment rate expected to edge up from 4.2 percent currently to 4.6 percent by mid-2028 as the economy returns toward balance and inflation moderates back to the 2–3 percent target band.
Productivity: The unresolved problem
Growth headline numbers look healthier in early 2026 than they did through most of 2023 and 2024. But there is one number that continues to concern economists: labour productivity.
For the full 2024-25 financial year, labour productivity fell 0.7 percent according to the ABS Australian System of National Accounts. Productivity — the amount of output produced per unit of labour input — is the fundamental driver of long-run living standards. An economy can grow by adding more workers or more hours, but sustained improvement in wages and household wealth ultimately depends on each worker becoming more productive over time.
The productivity decline in 2024-25 reflects a labour market that has added workers and hours faster than output has grown. Some of this is compositional — strong growth in labour-intensive sectors like care economy services, education, and hospitality — and some reflects the lag between business investment and productive output. Data centre investment, for example, is capital-intensive and may take years to flow through to measured productivity gains. But the sustained absence of productivity growth remains a genuine structural challenge for Australia’s medium-term economic performance, and one that the GDP headline number does nothing to resolve.
What does this mean for Australians?
For households, the data picture heading into 2026 is mixed in ways that aggregate growth figures can obscure. Real wages are recovering, GDP per capita is rising, and the labour market remains close to historically tight. Those are genuine positives after a difficult period.
But inflation is re-accelerating rather than continuing its decline toward the RBA’s target midpoint. The cash rate is back above 3.8 percent. The RBA’s own forecasts suggest underlying inflation will not return to the midpoint of its 2–3 percent target band until 2028. Mortgage holders who locked in variable rate debt during the low-rate era continue to face elevated repayment burdens relative to historical averages, and the saving rate data suggests many are prioritising debt management over discretionary spending.
The next ABS national accounts release, covering the March quarter 2026, is scheduled for 3 June 2026. That release will give the first read on whether the momentum from the second half of 2025 has continued into the new year or whether the RBA’s tightening has begun to cool activity. Given the February rate rise and the market pricing of further increases through 2026, the trajectory of consumer spending and business investment will be closely watched.
For those tracking wages data alongside GDP — understanding whether economic growth is actually translating into take-home pay — the ABS wage price index and the Fair Work Commission’s upcoming minimum wage determination will be the most important releases in the months ahead. For a full breakdown of what Australians in different industries are actually earning, the wages by industry data from the ABS provides the most granular picture available.
Whats the data shows, In plain terms
Australia’s economy grew at its fastest annual pace in three years through 2025. GDP per capita is recovering after an extended decline. Household consumption is rising. Business investment is strong. At the same time, inflation has surprised to the upside, the RBA has resumed rate rises, and productivity growth remains elusive. The headline number of 2.6 percent annual growth is real and significant. But so is the fine print.
For an economy navigating the intersection of population growth, housing pressure, and an inflation cycle that refuses to resolve cleanly, the GDP data is best read not as a verdict but as a status report. It confirms momentum. What it cannot confirm is whether that momentum is sustainable — or whether the rate rises now being priced into markets will cool the very activity driving the headline number higher.
This article contains economic data and analysis for informational purposes only. It does not constitute financial advice. Readers should consult a licensed financial adviser before making any financial decisions.