Cost of Living by Household Type in Australia 2026 — Pensioners vs Employees vs Retirees
Not every Australian household experiences inflation the same way. A pensioner, a mortgage-holding employee, and a self-funded retiree face very different cost pressures — even when the headline CPI figure is the same. The Australian Bureau of Statistics measures this through the Selected Living Cost Indexes, which track how price changes affect specific household types based on their actual spending patterns.
The March 2026 quarter data, released on 6 May 2026, shows the sharpest divergence between household types in years — with pensioners and government payment recipients experiencing record quarterly cost increases while employee households recorded a comparatively modest rise.
Here is a complete breakdown of what the ABS data shows for each household type.
What Are the Selected Living Cost Indexes?
The Selected Living Cost Indexes (SLCIs) are published quarterly by the Australian Bureau of Statistics. Unlike the Consumer Price Index — which measures price inflation for all households combined — the SLCIs measure how price changes affect the out-of-pocket expenses of specific types of households based on their actual spending patterns.
The SLCIs provide quarterly information about price change on the out-of-pocket living expenses for four population sub-groups: employee households, age pensioner households, other government transfer recipient households, and self-funded retiree households.
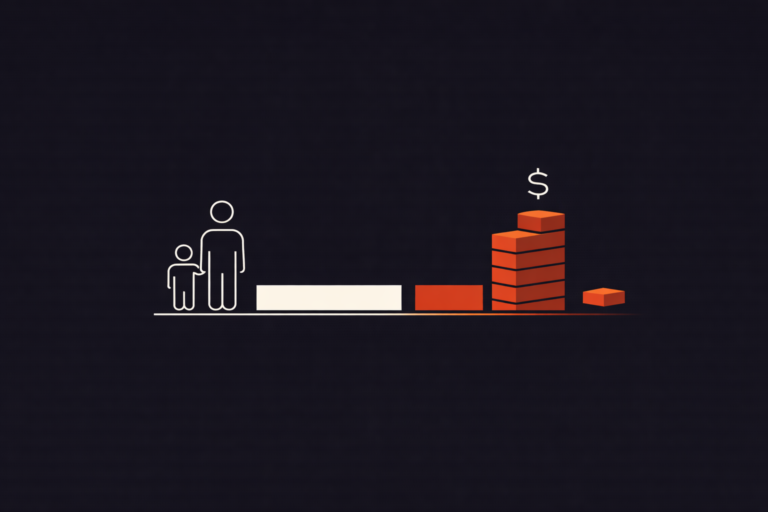
The distinction matters because different household types spend their money very differently. Pensioners spend a higher share of their income on food and health. Employees spend more on mortgage interest, education, and insurance. Self-funded retirees spend more on recreation and travel. When prices change in any of these categories, the impact on each household type is different.
March 2026 — Living Cost Changes by Household Type
Australia’s Living Cost Indexes for the March 2026 quarter show that living expenses rose across all household types, with increases ranging from 1.1% to 2.5% during the three months to March 2026.
Quarterly change (March 2026 quarter):
| Household Type | Quarterly Change | Annual Change |
|---|---|---|
| Pensioner and Beneficiary | +2.5% | +5.2% |
| Age Pensioner | +2.5% | ~+5.2% |
| Other Government Transfer Recipient | +2.5% | ~+5.0% |
| Self-funded Retiree | +1.1% | +3.8% |
| Employee | +1.4% | +2.6% |
Source: ABS Selected Living Cost Indexes, Australia, March 2026 (released 6 May 2026).
The rise for Pensioner and Beneficiary households was the largest since records began in June 2007, while the quarterly increase for Age Pensioner and Other Government Transfer Recipients was the largest since the September 2000 quarter.
Why Pensioners and Government Payment Recipients Are Being Hit Hardest
Three specific factors drove the outsized quarterly increase for government payment households in March 2026.
Electricity costs. Government payment recipient households saw the largest annual rises in living costs driven by bigger increases in electricity costs as rebates were exhausted. The Commonwealth Energy Bill Relief Fund, which had been reducing out-of-pocket electricity costs for eligible households through 2024 and early 2025, was used up. When these rebates expired, the underlying electricity price — which had risen significantly — became visible in household bills all at once.
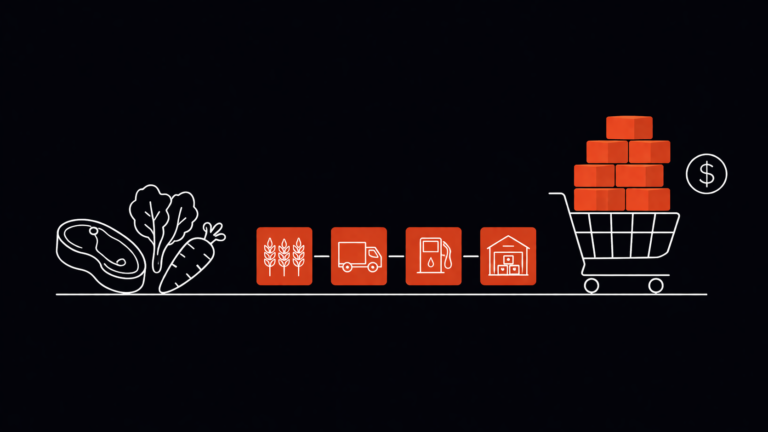
Food spending proportions. The proportion of expenditure allocated to Food and non-alcoholic beverages is highest for Age Pensioner households. Food prices rose 3.1 per cent annually to March 2026. For a household that spends a higher share of their budget on food than average, a 3.1 per cent food price rise has a larger total dollar impact than for households who spend a smaller share on food.
Pharmaceutical costs. Other government transfer recipients and Age Pensioner households pay concession prices for Pharmaceutical products and recorded a larger rise from the safety net threshold resetting compared with non-concession households. The PBS safety net threshold resets on 1 January each year, meaning households must spend to that threshold before their concession pricing kicks in fully. This creates a cyclical cost spike at the start of each calendar year.
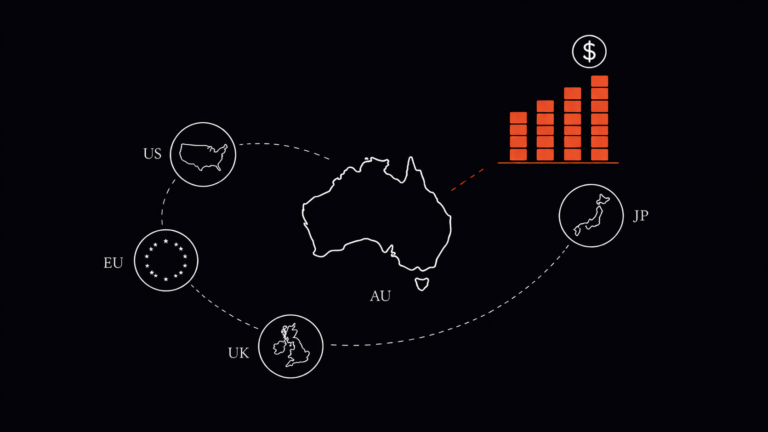
Transport. Transport rose across all household types, driven by Automotive fuel. Automotive fuel prices increased mainly due to a large increase in March reflecting the impact of the conflict in the Middle East on fuel prices.
Why Employee Households Are Experiencing the Smallest Annual Rise
Employee households recorded the smallest annual rise of 2.6% across all household types. Mortgage interest charges, which fell over the year, make up a higher proportion of expenditure for this household type. Mortgage interest charges fell 6.3% in the 12 months to the March 2026 quarter.
This is the key distinction. Employees tend to carry more mortgage debt than pensioners and retirees. When the RBA cut rates through 2024 and early 2025, those cuts flowed through to lower mortgage repayments for variable rate borrowers — significantly reducing a major expenditure item for employee households over the past year.
However, this dynamic is now reversing. Mortgage interest charges rose 1.5% in the March 2026 quarter, up from a fall of 2.8% in the December 2025 quarter. All banks passed on interest rate rises in full to variable home loans following the Reserve Bank of Australia’s decision to increase the cash rate in February. Most of the effects of the RBA’s cash rate hikes in both February and March 2026 will be seen in the June 2026 quarter.
This means the employee household advantage is likely to shrink significantly in the June 2026 quarter data, as the full impact of the February and March rate rises flows through to mortgage repayments.
For context on the RBA’s 2026 rate decisions and what they mean for household budgets, see our RBA interest rates 2026 guide.
Self-Funded Retirees — A Different Story
Self-funded retirees occupy a distinct position. They do not receive government payments, most do not have mortgages, and their spending skews toward recreation, travel, and health.
Self-funded retiree households have higher relative expenditure on Recreation and culture than the other household types. Health costs account for a significantly higher proportion of expenditure of Age Pensioner and Self-funded retiree households than the other household types.
Self-funded retiree households recorded an annual rise of 3.8%, with Recreation and culture — particularly Domestic holiday travel and accommodation — being a key driver. Domestic travel costs fell in March as the summer holiday season ended, which helped moderate the quarterly figure.
The self-funded retiree experience sits between employee households and pensioners — insulated from mortgage rate pressure, not reliant on government payments, but exposed to health cost increases and discretionary spending inflation.
How the Pension Is Indexed to These Figures
The SLCIs are not just analytical — they directly determine how government pensions are adjusted.
Government pensions are indexed on 20 September and 20 March by the greater of the rise in the Pensioner and Beneficiary LCI and the CPI over a six-month period.
This means that when the Pensioner and Beneficiary LCI rises faster than general CPI — as it has been in recent quarters — the pension is indexed to the higher PBLCI figure, providing some protection against the specific cost pressures pensioners face.
However, indexation is backward-looking. It compensates for past price rises, not current ones. The record 2.5 per cent quarterly increase in March 2026 will be captured in the next indexation adjustment — but households felt the cost increase well before any pension adjustment arrives.
For current pension payment rates and indexation dates, see our Centrelink payments 2026 guide.
What This Means for Household Budgets in Practice
The divergence between household types has real practical implications.
If you are a pensioner or government payment recipient: Your living costs are rising faster than any other household type. The expiry of electricity rebates and the resetting of pharmaceutical safety net thresholds have hit at the same time as fuel price spikes. If you have not already checked whether you are receiving all available concessions — for electricity, healthcare, transport, and council rates — doing so is worthwhile. Services Australia and state government concession schemes exist specifically to address the gap between payment levels and actual living costs.
If you are an employee with a mortgage: Your annual cost increase has been lower than average over the past year, primarily because falling mortgage rates offset other price rises. That cushion is now being removed as the RBA’s February and March 2026 rate hikes flow through. The June 2026 quarter data will likely show a meaningfully larger annual increase for employee households.
If you are a self-funded retiree: You are experiencing a moderate cost increase driven primarily by health and recreation costs. You are not directly affected by mortgage rate changes or government payment indexation, but healthcare inflation and any further fuel price pressure will affect your budget disproportionately.
For context on what the average Australian earns relative to these cost increases, see our average salary in Australia 2026 guide.
Frequently Asked Questions
What is the Selected Living Cost Index and how is it different from CPI?
The Consumer Price Index measures price inflation for all Australian households combined. The Selected Living Cost Indexes measure how price changes affect the actual out-of-pocket expenses of specific household types — employees, age pensioners, other government payment recipients, and self-funded retirees — based on their different spending patterns. The SLCIs are published quarterly by the ABS and are also used to determine pension indexation.
Why are pensioners experiencing higher cost increases than workers?
Pensioners spend a larger share of their income on food, health, and electricity — all of which have risen significantly. They do not benefit from falling mortgage interest charges, which have reduced costs for employee households over the past year. The expiry of government electricity rebates has also had a disproportionate impact on pensioner households, which have smaller electricity bills in absolute terms but allocate a higher share of their income to energy costs.
How does the Living Cost Index affect pension payments?
Government pensions are indexed to the higher of the Pensioner and Beneficiary LCI or the CPI over the preceding six-month period. This indexation occurs twice a year — on 20 March and 20 September. When pensioner living costs rise faster than general inflation, the pension is adjusted by the higher PBLCI figure rather than CPI.
Are these figures the same across all states?
No. The SLCIs are calculated for capital cities only and represent weighted average outcomes across the eight capital cities. Households in regional and remote areas face different cost pressures — often higher fuel costs, higher food prices due to transport costs, and more limited access to discounted services. The ABS does not publish state-level SLCI breakdowns.
When is the next Living Cost Index release?
The next release covering the June 2026 quarter is scheduled for 5 August 2026. That release will be the first to capture the full impact of the RBA’s February and March 2026 rate hikes on employee household mortgage costs, and will show whether fuel prices moderated following the April fuel excise cut.
Key Takeaways — Australia Living Cost Index March 2026
Living costs rose between 2.6% and 5.2% annually across Australian household types in the 12 months to March 2026. Pensioners and government payment recipients experienced the largest quarterly increase on record — driven by expiring electricity rebates, fuel price spikes, and pharmaceutical cost resets. Employee households recorded the smallest annual rise at 2.6%, primarily because falling mortgage interest charges offset other cost increases — an advantage that is now reversing as RBA rate hikes flow through. Self-funded retirees sit in the middle at 3.8% annual growth. The next SLCI release is due 5 August 2026 and will capture the June quarter impact of the RBA’s 2026 rate decisions.
General information only. Data sourced from ABS Selected Living Cost Indexes, Australia, March 2026 (released 6 May 2026). This article does not constitute financial advice. Verify current data at abs.gov.au.