Rent prices in Australia in 2026 are at record highs, with the national median dwelling rent reaching $681 per week by the end of 2025 and continuing to climb into the new year. For the roughly one-third of Australian households who rent, that number is more than a statistic — it is the single largest line item in their budget, and it has grown nearly 43% in five years.
The National Picture: Where Rents Stand Right Now
Australia’s rental market enters 2026 under structural pressure on two fronts: demand remains stubbornly strong, fuelled by population growth and constrained household formation, while supply of available rentals sits well below any reasonable measure of balance.
According to data from property analytics group Cotality, national rents rose 5.2% over the 2025 calendar year, pushing the national median to $681 per week. That pace was above inflation — the ABS recorded annual CPI growth of approximately 3.4% for the 12 months to November 2025 — meaning renters absorbed a real increase in housing costs for the fourth consecutive year.
The pace of growth also accelerated towards the end of 2025. The December quarter recorded a 1.3% quarterly increase in national rents, up from 0.9% in the September quarter. By January 2026, the annual rate of rental price growth had stepped up further to 5.4%, according to Cotality’s rolling data. That reacceleration is a concern economists had hoped to avoid after the market appeared to be cooling through mid-2024.
Rent inflation, as measured by the rents component of the ABS Consumer Price Index, stood at 3.9% in January 2026, easing slightly to 3.8% in February 2026. While this represents a significant moderation from the August 2023 peak of 7.8%, it remains above the long-run average of around 3%, and the directional trend in late 2025 and early 2026 is not encouraging for tenants.
State and Territory Breakdown: ABS Median Weekly Rents
The ABS tracks median weekly rent across all states and territories using its large administrative dataset of approximately 480,000 rental properties — the same dataset used to calculate the private rents component of the CPI. The most recent ABS data (published May 2025, covering the period to April 2025) shows the following median weekly rents:
| State / Territory | Median Weekly Rent (Apr 2025) | Median Weekly Rent (Apr 2019) | 6-Year Change |
|---|---|---|---|
| NSW | $650 | $480 | +35.4% |
| VIC | $520 | $385 | +35.1% |
| QLD | $560 | $380 | +47.4% |
| SA | $495 | $325 | +52.3% |
| WA | $613 | $350 | +75.1% |
| TAS | $430 | $270 | +59.3% |
| NT | $560 | $430 | +30.2% |
| ACT | $595 | $480 | +24.0% |
Source: ABS, Latest Insights into the Rental Market, released May 2025.
Western Australia recorded the most dramatic long-run shift, with median rents rising 75% over six years — from $350 to $613 per week. South Australia and Tasmania also saw increases well above the national average, driven by a combination of interstate migration, limited stock, and historically low base prices. NSW remains the most expensive state in absolute terms at $650 per week. The ACT, while high in absolute rent ($595), experienced the most contained growth of any state or territory over the period.
City-Level Data: Where the Pressure Is Most Acute
For capital city renters, the most recent quarterly data from Cotality (to end of 2025) offers a granular picture of where the market stands.
| Capital City | Median Weekly Rent (end-2025) | Annual Growth (2025) |
|---|---|---|
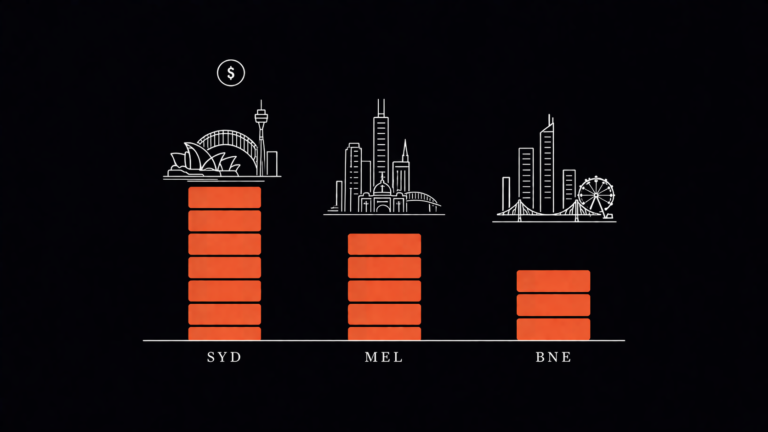
| Sydney | $817 | ~5.1% |
| Melbourne | ~$590 | 2.9% |
| Brisbane | ~$650 | ~5.0% |
| Perth | ~$700 | 5.9% |
| Adelaide | ~$610 | 3.4% |
| Darwin | ~$640 | 8.2% |
| Hobart | $601 | 7.2% |
| Canberra | ~$660 | ~3.0% |
Source: Cotality Quarterly Rental Review, Q4 2025. Figures for some cities are approximated from published annual growth rates applied to available quarterly base data.
Sydney remains the most expensive capital, with median dwelling rents at $817 per week — a figure that, annualised, represents $42,484 in rent before any other living costs. Darwin and Hobart posted the strongest annual growth at 8.2% and 7.2% respectively, reflecting the outsized impact of supply constraints in smaller markets. Melbourne recorded the softest growth at 2.9%, offering a relative — though modest — respite for tenants in that city.
It is worth noting that Domain’s September 2025 Rental Report, breaking out houses and units separately, recorded Sydney house rents at $780 per week and unit rents at $750 per week. Across the combined capitals, the average weekly rent for houses and units combined sat at $650 per week as at September 2025.
The Supply Problem: Why Rents Keep Rising
Understanding rent prices in Australia in 2026 requires understanding the supply side of the equation. The headline figure is stark: national rental listings are approximately 11% lower year-on-year and sit 17% below their five-year average, according to Cotality. The national vacancy rate fell to 1.7% by the end of 2025 — well below both the pre-COVID decade average of 3.3% and the 2.5% level widely considered a balanced market.
A vacancy rate of 1.7% means that for every 100 rental properties in Australia, fewer than two are sitting empty at any given time. That is a structural imbalance, and it gives landlords considerable pricing power in renewal negotiations.
The Australian Housing Accord — the federal government’s target of 1.2 million new homes between 2024 and 2029 — was reported to be approximately 20% behind target after 18 months, as of October 2025. Building approvals fell 6.4% in that month alone. Planning backlogs, elevated construction costs, and a shortage of skilled trades (see our coverage of Australia’s 2026 skills shortage and the industries most affected) continue to slow delivery. Sydney alone is estimated to need approximately 27,000 new homes annually but is on track to deliver roughly 12,300 apartments per year, according to CBRE’s 2026 Apartment Outlook report.
Population growth has moderated slightly from its post-COVID peak, but the pipeline of international students, skilled migrants, and working holiday visa holders returning to the market continues to underpin rental demand, particularly in inner-city and university-adjacent precincts.
Rental Affordability: A Record-High Stress Ratio
Perhaps the most alarming data point in the current rental environment is not the raw weekly rent figure — it is what that figure represents as a share of income.
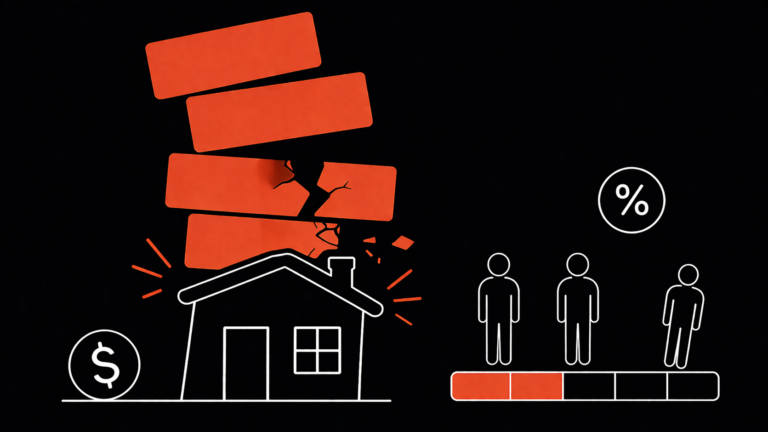
Cotality’s housing affordability metrics for the September quarter 2025 show that rental households are now dedicating an average of 33.4% of their pre-tax income to rent — a record high. A decade ago, that figure sat at 29.2%. At the trough of the pandemic in late 2020, it was 26.2%.
The conventional affordability threshold — used by social services agencies and housing researchers — is 30% of gross income. Australia’s renters, on average, have now exceeded that threshold.
The situation is most severe in Western Australia, where rents have risen 3.6 times faster than wages since 2020. Nationally, rents increased 43.9% over the five years to September 2025, compared with wage growth of approximately 17.8% over the same period — a divergence that, compounded year on year, has fundamentally eroded rental affordability for middle and lower-income Australians.
This has direct implications for workers on or near the minimum wage. With the Fair Work Commission setting Australia’s minimum wage at $24.10 per hour (as at July 2025), a full-time minimum wage worker earns approximately $916 gross per week. At the national median rent of $681, that represents 74% of gross weekly earnings going to rent alone. For more detail on how wages interact with housing costs, see our full breakdown of the minimum wage in Australia for 2026.
Regional Australia: Worse Than the Cities
While attention naturally concentrates on capital city markets, the data on regional rents is alarming in its own right. Regional rents rose 6.2% in 2025, outpacing the combined capitals measure of 4.8%.
Regional centres — particularly those with constrained land supply, strong tourism economies, or proximity to resource projects — have experienced some of the tightest rental conditions in the country. This mirrors the ABS’s own dataset findings, which show that rents in areas far from CBDs increased dramatically through the pandemic and remain elevated well above pre-pandemic levels, even as inner-city rents have also recovered.
The net result is that there is no longer a meaningful “escape valve” for renters priced out of capital city markets. Affordable regional alternatives have, in many cases, themselves become unaffordable.
The RBA Connection: How Rates Feed Into Rents
There is a widely misunderstood relationship between RBA interest rate decisions and rent prices. Higher interest rates do not typically lower rents in the short to medium term — they tend to raise them.
When borrowing costs increase, two things happen simultaneously: fewer renters can afford to buy, keeping them in the rental market longer; and property investors face higher debt servicing costs, which they often attempt to recover through rent increases. The RBA hiked the cash rate to 4.1% in March 2026 — the second consecutive increase in 2026, reversing the three cuts made through 2025. This tightening cycle, driven by sticky inflation sitting around 3.8%, will likely sustain demand in the rental market even as it suppresses new housing construction.
The rent component of the CPI itself carries significant weight in Australia’s official inflation calculation, meaning elevated rents contribute directly to the inflation the RBA is trying to cool. It is a feedback loop that policymakers acknowledge but have limited direct tools to break. For a full analysis of where rates are headed, see our RBA interest rate timeline and impact for 2026.
What the Outlook Looks Like for Tenants
The consensus across major property research groups heading into 2026 is that rental relief is not imminent.
CBRE’s 2026 Apartment Outlook, released in late March 2026, forecasts that median apartment rents across 53 capital-city precincts will rise 27% between 2025 and 2030. By 2030, CBRE estimates that 83% of two-bedroom apartments nationally will have weekly rents exceeding $700, with 36% exceeding $1,000 per week.
Domain’s 2026 forecast projects rents will continue rising in Sydney, Melbourne, and Canberra, driven by a combination of rising household incomes and persistent undersupply. Perth’s rental market is showing early signs of moderation after years of extraordinary growth. Vacancy rates are expected to edge slightly higher from current historic lows — but not by enough to materially ease pressure on tenants.
KPMG’s January 2026 residential property market outlook put annual rent growth at approximately 3.5% through 2026 and 2027, and estimated that new dwelling completions would need to be around 17% higher than current forecasts to bring rental growth back to the long-term average. That uplift in supply is not currently visible in the pipeline data.
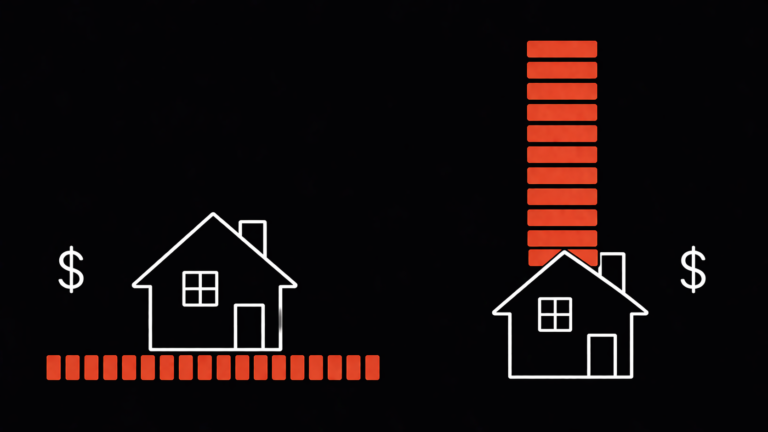
For renters considering whether ownership is a financially rational alternative, note that — despite high rents — renting remains cheaper than buying in many parts of Australia in 2026 due to the elevated RBA cash rate and its impact on mortgage repayments. That calculation changes materially if rates fall and property values rise, as they have through most of the past two years. For a full state-by-state breakdown of purchase prices, see our Australian home prices by city for 2026.
FAQ
What is the average rent in Australia in 2026?
The national median weekly rent reached $681 by the end of 2025, according to Cotality’s Quarterly Rental Review. That figure has continued rising into 2026. In Sydney, median dwelling rents are now $817 per week — the most expensive capital city in the country.
Which Australian city has the cheapest rent in 2026?
Based on Cotality data for end-2025, Hobart is the most affordable capital city at $601 per week for median dwelling rent. However, Hobart also recorded 7.2% annual rental growth in 2025 — one of the strongest increases nationally — so relative affordability is narrowing.
How much have rents increased in Australia over the past five years?
According to Cotality, national rents have risen approximately 42.9% over the five years to end-2025. Wages grew around 17.8% over the same period, meaning rents have risen nearly three times faster than incomes.
What is the rental vacancy rate in Australia in 2026?
The national rental vacancy rate fell to 1.7% at the end of 2025, well below the pre-COVID decade average of 3.3%. A vacancy rate below 2.5% is generally considered to indicate a landlord’s market with limited negotiating power for tenants.
Is the government doing anything to reduce rent prices?
The federal government’s National Housing Accord targets 1.2 million new homes by 2029, but delivery was approximately 20% behind schedule as of late 2025. State governments have introduced planning reforms in NSW, Victoria, and Queensland to accelerate approvals, but these are yet to materially increase housing supply. Commonwealth Rent Assistance remains available to eligible renters through Services Australia. For a detailed breakdown of assistance schemes available to home buyers, see our guide to first home buyer schemes in Australia for 2026.
Conclusion
Rent prices across Australia in 2026 reflect an underlying structural imbalance that short-term policy measures are unlikely to resolve quickly. With the national median at $681 per week, vacancy rates near record lows, and the average renter spending more than a third of their pre-tax income on housing, the data paints a sobering picture. The primary driver is supply: Australia is not building homes fast enough to house the people who live here. Until that changes, the directional pressure on rents will remain upward.
This article is for informational purposes only and does not constitute financial, legal, or migration advice. Data is sourced from publicly available Australian government sources and reputable property research organisations, and is accurate at time of publication. Please consult a registered professional for advice specific to your situation.