Australia’s Electricity Bills in 2026 — What the ABS Data Actually Shows
Australian electricity bills have recorded one of the sharpest rises of any household expense in recent memory. According to the latest data from the Australian Bureau of Statistics, electricity costs rose 37 per cent in the 12 months to February 2026.
That number demands context. Here is what the publicly available data shows, and why the figure is more complicated than it first appears.
What the ABS Data Shows About Electricity Prices in 2026
The Australian Bureau of Statistics publishes a Consumer Price Index every month that tracks price changes across household expenditure categories. The most recent data at the time of writing shows the following:
Electricity costs rose 37 per cent in the 12 months to February 2026, up from a 32.2 per cent rise in the 12 months to January 2026. This makes electricity the single largest contributor to housing inflation, which itself rose 7.2 per cent annually — the biggest category contributor to overall CPI inflation in Australia.
Overall CPI inflation was 3.7 per cent in the 12 months to February 2026, according to the ABS.
Why the 37 Per Cent Figure Is Misleading Without Context
The 37 per cent annual rise in electricity costs sounds alarming — and for household budgets it is significant. But it requires careful interpretation.
The ABS measures electricity costs as what households actually pay out of pocket. When government rebates reduce bills, the ABS records lower electricity prices. When those rebates expire or are used up, the ABS records higher electricity prices — even if the underlying tariff charged by energy retailers has not changed dramatically.
According to the ABS, excluding the impact of Commonwealth and State Government electricity rebates over the previous year, electricity prices rose 4.9 per cent in the 12 months to February 2026. This reflects the annual price reviews conducted by energy retailers in July 2025.
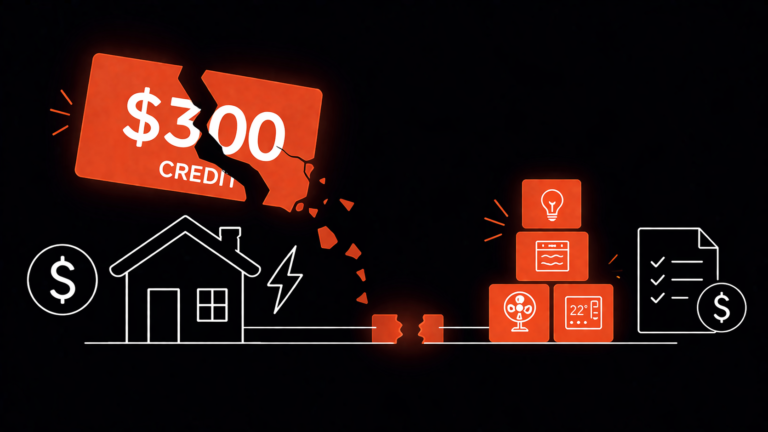
The 37 per cent figure therefore largely reflects the expiry of the Commonwealth Energy Bill Relief Fund (EBRF) rebates and various State Government rebate programs — not a 37 per cent increase in the underlying cost of electricity from retailers.
The Energy Bill Relief Fund — What It Was and What Happened
The Commonwealth Energy Bill Relief Fund was a federal government program that provided direct credits to household electricity bills to ease cost of living pressure. Similar state-level programs operated in Queensland, Western Australia, and other states.
While these rebates were active, they appeared in the ABS data as lower electricity prices. As households exhausted these credits through 2025 and into early 2026, the measured cost of electricity increased sharply — not because retailers raised prices dramatically, but because the subsidy buffer was gone.
For more on how government cost of living measures affect everyday prices, see our cost of living coverage.
What Australian Households Are Actually Paying for Electricity
The underlying retail electricity price increases are more modest than the headline CPI figure suggests but still meaningful. According to EnergyPlans research based on Australian Energy Regulator reference data electricity prices across Australian states increased between 2.9 per cent and 5.1 per cent year on year in 2026, depending on the state.
For a typical Australian household consuming approximately 4,900 kilowatt hours per year — the standard benchmark used by the Australian Energy Regulator — this translates to a meaningful increase in annual bills across every state.
Average Annual Electricity Bills by State — 2025–26
| State | Typical Annual Bill | Default/Standing Offer (c/kWh) | Regulator |
|---|---|---|---|
| New South Wales | $2,420–$2,760 | ~32–36c | AER (DMO 7) |
| Queensland (SE) | $2,140 | ~33–37c | AER (DMO 7) |
| South Australia | $2,385 | ~48–52c | AER (DMO 7) |
| Victoria | $1,850–$2,100 | ~28–34c | ESC (VDO) |
| Western Australia | $1,600 | ~31c | Synergy (regulated) |
| Tasmania | $1,750 | ~28–30c | TasNetworks |
Source: Australian Energy Regulator Default Market Offer 2025–26; state regulators. Bills based on typical household consumption of 3,900–5,500 kWh/year.
How to Cut Your Electricity Bill Without Switching Off Everything
Most households overpay simply because they are on a standing offer — the default rate your retailer puts you on when you first sign up. The Australian Energy Regulator estimates that households on standing offers pay significantly more than those on market offers from the same retailer.
Three things that actually move the number:
Compare and switch retailers. The government’s Energy Made Easy tool (energymadeeasy.gov.au) lets you enter your current bill and compare every available offer in your area. In most states, switching to a competitive market offer saves between $200 and $500 per year for no change in usage.
Check your concession eligibility. State governments run separate concession schemes on top of the federal rebate. In NSW, eligible households get an additional Low Income Household Rebate through Energy Accounts Payment Assistance (EAPA). Victoria has the Power Saving Bonus. Queensland has the Home Energy Emergency Assistance Scheme. If you hold a Health Care Card, Pensioner Concession Card, or DVA Gold Card, you are almost certainly entitled to a rebate you may not be claiming.
Shift usage to off-peak hours. If you are on a time-of-use tariff — which most smart meter households are — peak rates (typically 2pm–8pm weekdays) can be two to three times higher than off-peak. Running the dishwasher, washing machine, and EV charger after 10pm costs a fraction of running them at 6pm.
The single highest-impact action for most households is the first one: check Energy Made Easy, find a better rate, and switch. It takes under 15 minutes.
Why Electricity Prices Rose
Several factors have driven the underlying increase in retail electricity costs. Energy retailers conduct annual price reviews each July, and the July 2025 review resulted in increases across most states. These increases reflect higher network costs — the charges for maintaining transmission and distribution infrastructure — as well as wholesale electricity market dynamics driven by the mix of generation sources including coal, gas, and renewables.
South Australia, which has a high proportion of renewable energy and relies on gas for backup generation, typically records higher electricity prices than other states. Western Australia operates a separate electricity market and has its own pricing dynamics.
For more on how energy costs affect the broader cost of living, see our article on Australia’s rent crisis.
The Real Cost — Electricity Versus Wages
The most important question for household budgets is not whether electricity prices rose, but whether wages kept pace. According to the ABS Wage Price Index for the December quarter 2025, wages rose 3.4 per cent in the year to December 2025.
Even excluding the rebate effect, electricity prices rose 4.9 per cent in the underlying measure — ahead of wage growth of 3.4 per cent. For households on fixed or lower incomes, electricity represents a larger share of total spending, meaning the same percentage increase takes a bigger bite out of a tighter budget.
The Reserve Bank of Australia has consistently identified energy prices as a key driver of non-tradable inflation — the inflation that comes from domestic factors rather than global commodity prices. For more on how the RBA’s decisions affect everyday costs, see our Explained section.
What to Expect from Electricity Prices in 2026
The expiry of government rebates means the base from which future electricity price changes are measured has reset higher. Future annual reviews by energy retailers in July 2026 will determine whether retail tariffs increase further or stabilise.
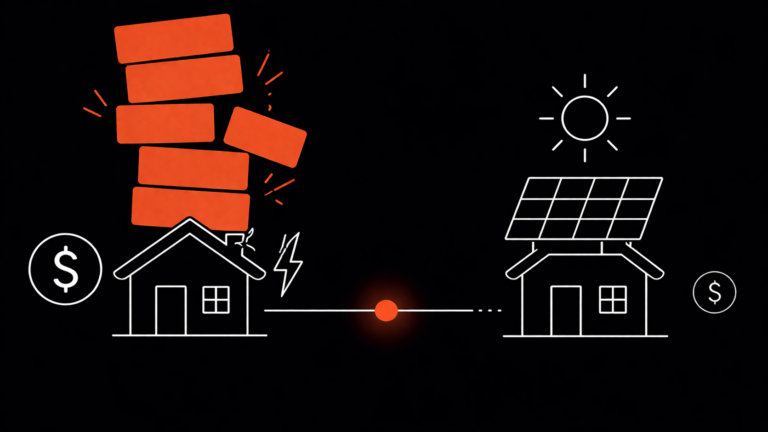
Solar panels and battery storage are beginning to provide meaningful cost relief for households with these technologies installed, according to EnergyPlans research. For renters and households without the capital to invest in solar, however, these options are not immediately accessible.
The Australian Energy Regulator publishes default market offer prices each year which cap what retailers can charge customers on standing offers. Checking the AER’s current reference prices at aer.gov.au is the most direct way to understand what a competitive electricity plan should cost in your state.
From 1 July 2026, the AER is also introducing a Solar Sharer Offer — an opt-in plan that provides three hours of free electricity during midday to help households shift usage to when solar generation is cheapest.
Frequently Asked Questions
Why are electricity prices so high in South Australia compared to other states?
South Australia has the highest electricity prices in Australia, primarily because the state has a high share of renewable energy but limited interconnection with the eastern grid. When renewable generation drops — on still, cloudy days — South Australia relies heavily on gas peakers, which are expensive to run. Network costs in a geographically large, low-density state also add to the base rate.
What is the Default Market Offer and does it affect me?
The Default Market Offer (DMO) is a price cap set by the Australian Energy Regulator each year for households in NSW, south-east Queensland, and South Australia. If you have never switched retailers or are on a basic standing offer, you are likely paying at or near the DMO rate. It is not the cheapest available rate — it is a safety net. Most households can find cheaper options by comparing on energymadeeasy.gov.au.
Is the federal energy rebate still running in 2026?
The federal government’s energy bill relief program provided $300 to eligible households across 2024–25. Whether this continues into 2025–26 depends on the current federal budget — check energy.gov.au or your state government’s energy website for the most current information on active rebates.
Do solar panels actually reduce bills in 2026?
Yes, but the economics have changed. Feed-in tariffs — the rate retailers pay you for excess solar exported to the grid — have dropped significantly in most states, now sitting between 4c and 10c per kWh in most markets. The benefit of solar now comes mainly from self-consumption during the day, not from export income. Households with solar should consider battery storage or shifting daytime usage to maximise the value.
Which state has the cheapest electricity in Australia?
The ACT and Western Australia consistently have lower typical bills than the eastern states, though for different reasons. WA uses a regulated, government-owned retailer (Synergy) with politically managed pricing. The ACT has high renewable penetration and strong concession schemes.
Where Electricity Prices Stand in 2026
Based on the most recent ABS data and publicly available energy market information:
Electricity costs rose 37 per cent in the 12 months to February 2026 on an out-of-pocket basis, primarily reflecting the expiry of government rebate programs. Excluding the rebate effect, the underlying increase was approximately 4.9 per cent — driven by the July 2025 annual retail price reviews. Wages grew 3.4 per cent over the same period, meaning electricity costs outpaced wage growth even on the underlying measure. Government rebate programs provided temporary relief but their expiry has reset household electricity costs to higher baseline levels. The ABS will continue publishing monthly CPI data tracking electricity costs — and Fenro will report on it as new data is released.
For the full picture of what is driving Australian household costs right now, see our coverage of grocery prices Australia 2026.
This article is for general informational purposes only and reflects the author’s own research and understanding of publicly available data. It does not constitute financial advice. Data was accurate at the time of writing — always verify current figures directly with the ABS, AER, and other cited sources.
Related Articles
- Energy Rebates Australia 2026 — federal and state rebates reducing your electricity bill
- Solar Power Savings 2026 — how solar reduces electricity costs in Australia
- Gas Prices Australia 2026 — comparing electricity and gas costs for Australian households
- RBA Cash Rate 2026 — interest rate context for household budget pressures